What the Numbers Are Telling Us: A Reality Check (May 2025)
Issue #19 Markets are up, but are they healthy?
Since hitting a low in February 2025, Indian equity markets have bounced back. But beneath the surface, the data shows several warning signs that retail investors should be aware of. Here’s a breakdown of the latest insights from DSP’s May 2025 NETRA report —
1. The Market Rally Is Not Broad-Based
While the overall index is up, most stocks are not participating in the rally:
More stocks hit 52-week lows than highs.
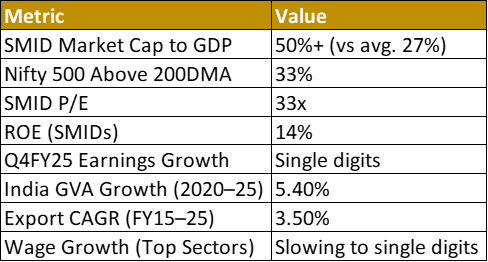
Only 33% of stocks in the Nifty 500 are trading above their 200-day moving average (DMA) as of Apr’25 vs 64% in Apr’23. That’s quite low and suggests price strength is missing across most companies.
This means the bounce we are seeing is being led by a small set of stocks — not a healthy, broad-based recovery.
2. Small & Mid Caps (SMIDs) Are Expensive
Historically, SMIDs outperform large caps in bull markets but fall harder during corrections. Right now:
The SMID market cap-to-GDP ratio peaked at 64% in Sept 2024 and is still over 50%, well above the long-term average of 27%.
SMID valuations are high — P/E ratio is 33x, while earnings growth has been in single digits for six quarters.
Return on Equity (ROE) is around 14%, not extraordinary given the high valuation.
What this means: These stocks are priced for perfection, but earnings aren’t delivering. That leaves little "margin of safety" if anything goes wrong.
3. Risk Trio: Slow Sales, Lower Margins & High Valuations
For the Nifty 500 (excluding financials):
Revenue growth for 4QFY25 (till April 29) is in low single digits.
PAT (profit after tax) margins have slipped from earlier peaks.
Profit growth (TTM) is struggling.
Despite this, the market is still pricing in high growth expectations, which creates a risk of disappointment.
4. Growth and Trade Are Slowing
India's long-term Gross Value Added (GVA) growth has slowed:
From 6.4% in 2010–2020 to 5.4% in 2020–2025.
Services — once the growth engine — are now seeing momentum fade.
External trade also looks weak:
Export growth (CAGR) fell from 14% (FY05-15) to just 3.5% (FY15-25). Export reached $438bn in FY25 which was $310bn in FY15.
Imports also slowed, dragging net trade performance.
This slowdown raises questions about India’s ability to maintain robust long-term growth without new growth drivers.
5. High-Frequency Data Shows Economic Fatigue
GST collection growth is slowing.
Petroleum product sales and e-toll collections are flatlining — signs that consumption and movement are plateauing.
Wage growth in IT (5% in FY24), finance (2% in FY24), and auto (11% in FY24) vs Long Term Average of 14%, key urban drivers — is cooling off. In real terms (after inflation), wage growth is nearly zero.
All this suggests urban consumption could weaken further if wage trends don’t improve.
6. Silver: A Contrarian Bright Spot?
Unlike gold, silver hasn’t seen a major rally:
Gold recently hit $3,500/oz, silver is still below $35/oz.
The gold-to-silver ratio is near 100, historically considered high.
Silver is in its fifth straight year of supply deficit, and most of it is used up in industrial applications, not hoarded. If demand continues and supply doesn’t increase, silver could have more room to run than gold.
Markets Are Cyclical
Just like the ancient symbol Ouroboros — a snake eating its own tail — markets move in cycles. Bull markets give birth to bear markets, and vice versa. Today’s overvaluation and slowing fundamentals might be setting up the next correction — or a phase of time-based "cooling off."
As investors, staying alert to data and avoiding herd mentality is more important than ever.
Let me know in the comments: Are you rotating into large caps, still riding the SMID wave, or going stock-specific within SMIDs?
Until next time,
Priyank Agarwal
Stay curious


