


Market Cycles
A Deep Dive into India's Market Evolution

Issue #01 Markets are never static; they are governed by cycles that repeat, though with unique traits every time.
Market Cycles
Market cycles represent periods of expansion and contraction in stock prices, influenced by macroeconomic factors, investor sentiment, and corporate performance, while patterns repeat, no two cycles are identical in their characteristics or drivers.
India’s market journey can be segmented into 4 key cycles:
2002–2007: A historic bull market, characterized by sixfold growth in the Nifty.
2007–2013: A prolonged bear market with stagnating indices.
2013–2019: Moderate, steady growth with the Nifty doubling.
2019–2024: A unique bull market defined by post-COVID recovery and India-specific factors.
2002–2007: A Demand-Led Bull Market
This cycle is widely regarded as India’s most significant bull run. The Nifty rose 6x within 5 years, with GDP and corporate profits soaring.
Key Drivers:
Global demand boom: Corporate revenues grew at an unprecedented ~30% CAGR.
Strong domestic credit growth: Fuelled by high demand across industries.
Global synchronization: A booming phase for emerging markets worldwide.
Sector Highlight:
Capital goods emerged as the star performer, with the Capital Goods Index increasing 20x. Investors who allocated funds to this sector, even late in the cycle, reaped massive rewards.
2007–2013: A Challenging Bear Market
After the peak of 2007, the market entered a 6-year-long bear phase, with the Nifty showing no significant gains.
Characteristics:
Economic slowdown and stagnation in corporate profits.
High inflation and policy paralysis at the domestic level.
Global financial crisis (2008) and its aftermath added to the challenges.
For investors, this period was about survival and managing risk rather than chasing returns.
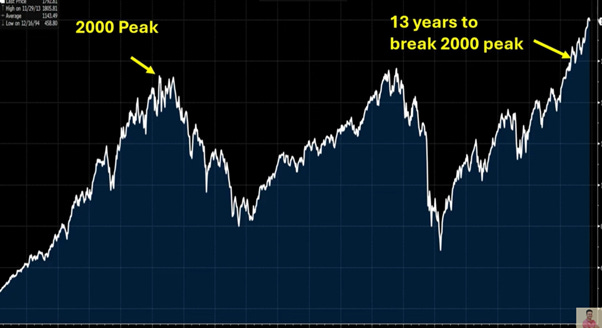
For S&P500, it took the index 13 years to break the 2000 peak.
2013–2019: A Moderate Growth Cycle
This period marked a return to stability, though not at the explosive pace of the 2002–2007 cycle.
Key Traits:
The Nifty doubled in 6 years, reflecting moderate growth.
Stable government policies under Modi’s leadership brought optimism.
Corporate profits improved, but global headwinds, such as trade wars, kept growth in check.
2019–2024: The Post-COVID Bull Market
The current cycle stands out as unique in several ways.
India vs. Global Performance:
Unlike the synchronized growth seen in earlier bull markets, this cycle is driven by India-specific factors.
The MSCI Emerging Markets Index has remained flat in dollar terms, while Indian indices have significantly outperformed.

India’s growth story is independent of global trends, showcasing resilience.
Supply-Side Dynamics:
Unlike the demand-led growth of earlier bull markets, this cycle is fueled by supply-side efficiencies. Corporate India has capitalized on global disruptions to capture market share in manufacturing, exports, and services.
Rolling Themes:
A defining feature of this cycle is the rolling nature of market leadership:
2020: IT stocks surged post-COVID as digital transformation became the focus.
2021: Metals and chemicals rallied, driven by the China+1 strategy.
2022: Banking emerged as a top-performing sector due to strong credit growth and low NPAs.
Each theme has a shorter lifespan, requiring investors to adapt quickly to changing trends.
Comparison of Cycles: Then vs. Now

Investment Takeaways
Adapt to Rolling Themes: Unlike past cycles, this market demands agility. Investors must stay informed and pivot their portfolios to capitalize on emerging themes.
Focus on Supply-Side Opportunities: Industries benefiting from supply-chain disruptions, such as manufacturing and exports, are likely to outperform.
India is a Bright Spot: Despite global challenges, India offers unique growth opportunities due to its robust fundamentals and reforms.
Sector Rotation is Key: No single sector will dominate for long. Monitoring macro trends and shifting allocations is critical.
Why You Should Be Cautious in Today's Market
As investors, we're always on the lookout for opportunities that promise high returns. But the reality is, sometimes the best move is to sit tight and watch from the sidelines. Right now, the market is sending off some serious red flags that are hard to ignore.


The Gravity of Market Valuation
You’ve probably heard of the saying, "What goes up must come down." Well, that’s pretty much how the market works too. If we look at where the market is today, it feels like we’re in a repeat of 2007. While things looked rosy back then, we all know what happened next – a massive crash. Fast forward to today, and the market’s valuation is eerily similar.
But here’s the twist – while valuations are sky-high, the demand is just not there. This isn’t a repeat of the bull run we saw in 2007. It feels more like 2002, where demand was sluggish, and fundamentals were weak. So, what does that mean for us? We might be heading toward a painful correction in the near future.
Are We in for a Flat Market?
A lot of people are still holding onto hope that the market will keep climbing, but the truth is, the next five years might not bring the kind of returns we’re used to. If you’re expecting another 10x growth, think again. Instead, we could be looking at a flat market, with indices like the Nifty stuck at the same levels for years. It’s a tough pill to swallow, but it’s better to face the truth now rather than later.
In sectors like commodities, where companies are trading at astronomical valuations (100 PE), the bubble could burst any moment. When margins peak, stock prices will have nowhere to go but down. So, expect a lot of sideways movement and even some painful corrections. The market won’t be the easy ride it once was.

Valuation Metrics to Keep in Mind
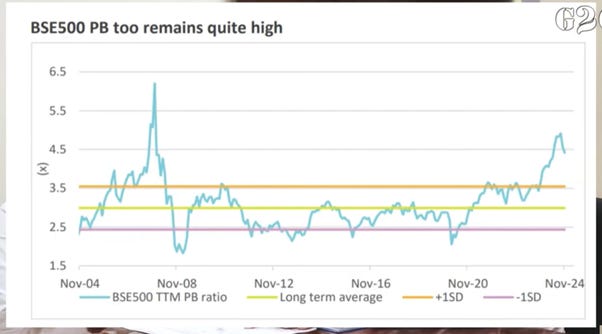
You’ve probably heard about Price-to-Earnings (P/E) ratios, but here’s a better metric to focus on in India: Price-to-Book (P/B) ratio. In a country like ours, with so many asset-heavy businesses (think financials and commodities), P/B tends to give us a clearer picture. Historically, we’ve seen solid returns when P/B is below 2.5. Once it crosses 3, things start to get dicey.

The Indian market’s P/B ratio is sitting at dangerously high levels right now. Along with this, the market cap-to-GDP ratio is also above historical averages, signaling that stocks are overvalued. These are warning signs that can’t be ignored.

Why Capital Allocation is Key
One of the most overlooked factors in investing is how companies allocate their capital. It’s not enough for a business to just have solid revenue; it needs to use its profits wisely to generate more growth. Capital allocation is the difference between a company that grows sustainably and one that falls flat when things get tough.
What should you be looking for? Well, one of the best metrics is the return on capital. If a company isn’t generating at least 15% return on its capital, it’s probably not worth your investment. Capital efficiency is crucial, especially in times of economic uncertainty.

The Post-COVID Capital Shift
If there’s one silver lining in today’s market, it’s the improvement in capital efficiency post-COVID. Larger companies have gained more leverage with their suppliers and are better able to manage working capital. This has given them a competitive edge, allowing them to weather economic storms better than smaller businesses.
But remember, it’s not all sunshine and rainbows. The big corporates have had an easier time cutting deals, especially with MSMEs (Micro, Small, and Medium Enterprises), which don’t always show up in official market stats. This doesn’t necessarily reflect the broader economic recovery, which still remains a mixed bag.
India’s Economic Cycle: The Long-Term View
Looking at the long-term trend of India’s economic cycle, we’ve gone through three key phases:
2004-2011: This was the boom period when India’s economy was growing fast, and companies were investing heavily. Profits and growth were soaring.
2011-2019: The phase of slowdown. Economic growth flattened out, and profits weren’t as great. A lot of businesses struggled to keep up.
Post-2019: The recovery phase. Things are slowly getting back on track, and margins are improving. But the question is, how long will it last?
Key Takeaways
Understanding market cycles is crucial for navigating volatility and identifying opportunities. From the demand-driven boom of 2002–2007 to the rolling, supply-side dynamics of today, each cycle has its own story and lessons.
So, what’s the bottom line? The market is expensive right now, and even though we’re seeing some signs of recovery, the fundamentals just don’t match the sky-high valuations. If you’re thinking of jumping into the market, be extra cautious. Focus on capital allocation, watch out for companies that can generate high returns, and avoid getting caught up in the hype.
For investors, this is a time to remain agile, focus on India’s growth trajectory, and align strategies with the evolving market dynamics. Whether you’re a long-term investor or a short-term trader, recognizing these patterns can make all the difference.
In the end, the best investments are the ones that you can hold for the long term, bought at the right price. So, take your time, do your homework, and remember, sometimes the best investment is the one you don’t make.
Let me know your thoughts! 📢
Much love,
Priyank
Source: